


For Sales Organizations
Territories drawn by your data, not by a map and a whiteboard.
Sales territory design is one of the most consequential decisions a sales organization makes and one of the most manual. We use AI clustering techniques on your own customer data to find the territory boundaries that actually exist in your book of business, rather than the ones that are easy to draw.
Contact UsThe Problem
Every territory map is a compromise nobody can fully see.
Sales leadership iterates through customer-to-territory assignments trying to satisfy competing constraints at once: geographic proximity so a rep can actually cover their accounts, but also balanced workload, balanced revenue potential, and reasonable travel. Doing this by hand means most of those constraints get satisfied by intuition rather than analysis. The existing tools mostly apply fixed rules, which produces defensible maps that don't reflect how your customers are actually distributed.
How It Works
Find the structure that's already in your data.
Start from your customer data
Geocoded account locations from your CRM, plus the attributes that matter to how you sell — revenue, account size, industry, coverage requirements.
Cluster on what actually separates territories
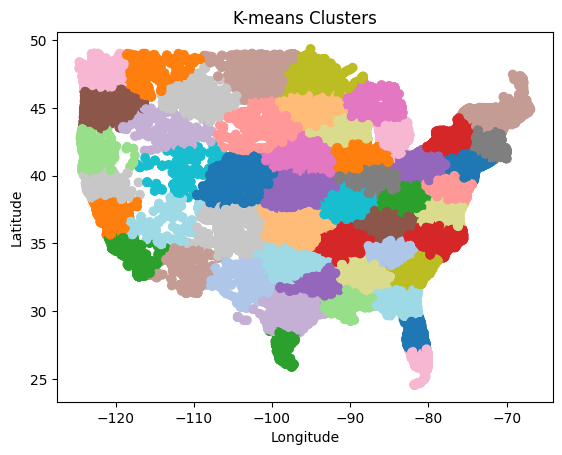
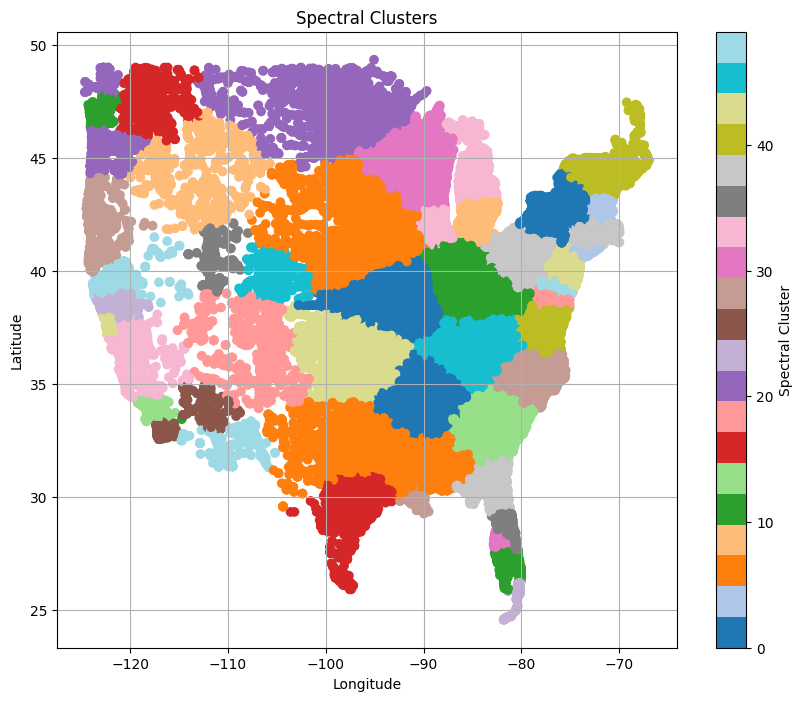
AI clustering models find the structure your data actually has. K-means gives a fast geographic baseline. Spectral clustering goes further, finding natural, non-spherical boundaries that follow real density patterns rather than forcing accounts into circular regions.
Evaluate against business reality, not just cluster metrics
Clustering quality scores measure mathematical compactness. Territory quality means workload balance, travel feasibility, and whether a sales leader would actually deploy the map. Those aren't the same thing, and we optimize for the second.
Deliver territories your team can operate
Boundaries you can review, adjust, and load back into Salesforce — with the analysis behind each one available when someone asks why their territory changed.
What We Learned
The better-scoring algorithm produced the worse territories.
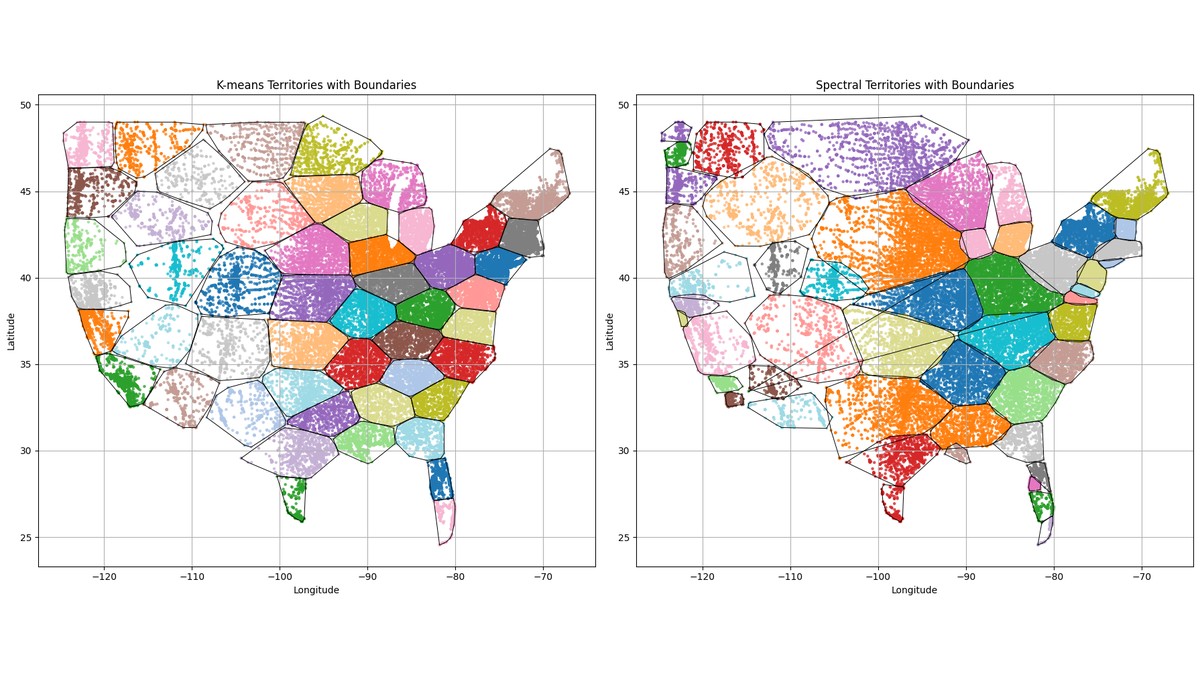
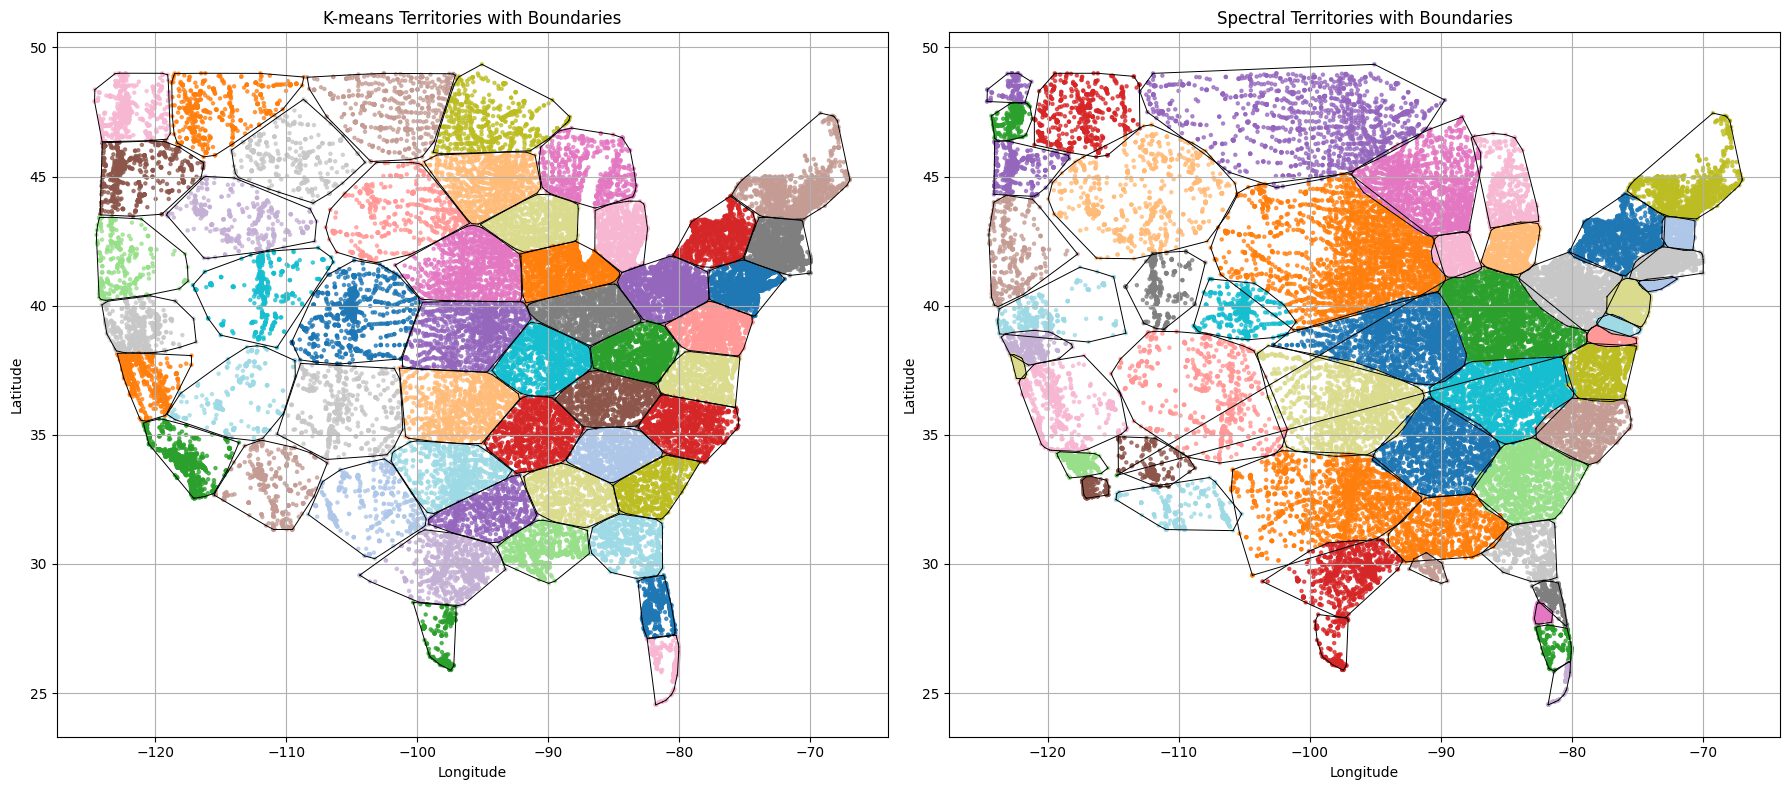
In our own research on a dataset of 71,000 commercial real estate properties across the lower 48 states, K-means outperformed spectral clustering on every standard clustering metric — Silhouette, Davies-Bouldin, and Calinski-Harabasz. It also produced territories a sales organization shouldn't use. K-means assumes roughly spherical, equally-sized clusters, and that assumption breaks in dense metropolitan areas, where it produced territories badly unbalanced in account count. Spectral clustering responded to population density instead: six territories in Florida where K-means drew four, with similar adjustments in the Bay Area, LA, the Mid-Atlantic, and the Northeast corridor.
The lesson generalizes well beyond territory design. Internal metrics measure what's easy to measure. When they diverge from the business outcome, the metrics are the thing to question.
Why This Approach
Boundaries that reflect reality
Territories follow the density patterns actually present in your customer base, rather than geometry imposed on top of them.
Balanced coverage in dense markets
Metro areas get the territory count their account concentration warrants, instead of being flattened into regions no rep can realistically cover.
Analysis you can defend
Territory changes are contentious. Every boundary traces back to the data and criteria that produced it — so the conversation is about the inputs, not about whose judgment was better.
Where this fits
- Redesign territories at annual planning without weeks of manual iteration
- Rebalance coverage where account concentration has shifted since the last redraw
- Bring analytical grounding to a process currently driven by precedent and negotiation
- Model alternative territory structures before committing to one
Geography is the starting point, not the whole problem.
Clustering on location and density is well-understood and produces genuinely better maps. Balancing simultaneously across revenue, account count, customer size, and industry coverage is a harder problem — formally a constraint satisfaction problem, and one whose complexity grows sharply with each constraint added. We scope that work explicitly rather than implying it comes free with the clustering.
Case Study
Why the Better-Scoring Algorithm Produced Worse Sales Territories
K-means outperformed spectral clustering on every standard metric — and produced territories no sales organization should use.